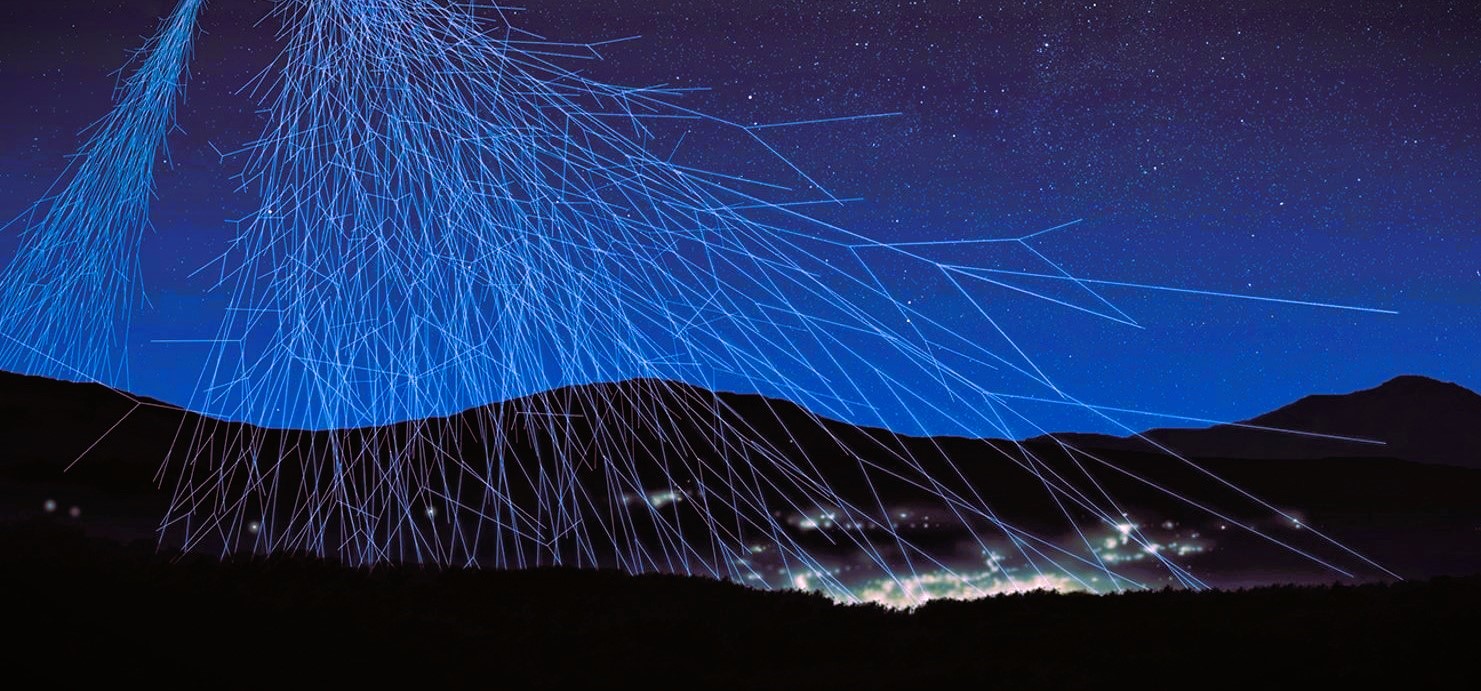
One of the elements necessary to analyze muon telescope muon data is muon photographs obtained in simulations of real scenarios to be observed.
The simulations make enable to predict the results and discover, by comparison with the muographies obtained in the field, unknown elements in the observation area.
To analyze the muographic information obtained from real observations, simulations used as references are built. The software used to develop the simulations is Geant4, which was designed by CERN to simulate the path of particles. This same software is used in muography to simulate the creation and injection of muons through matter and their detection in planes sensitive to their passage.
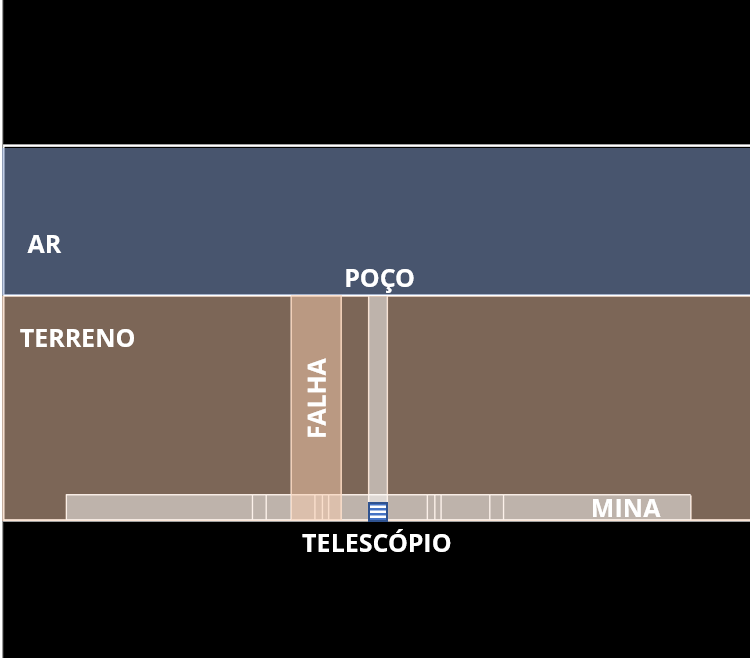
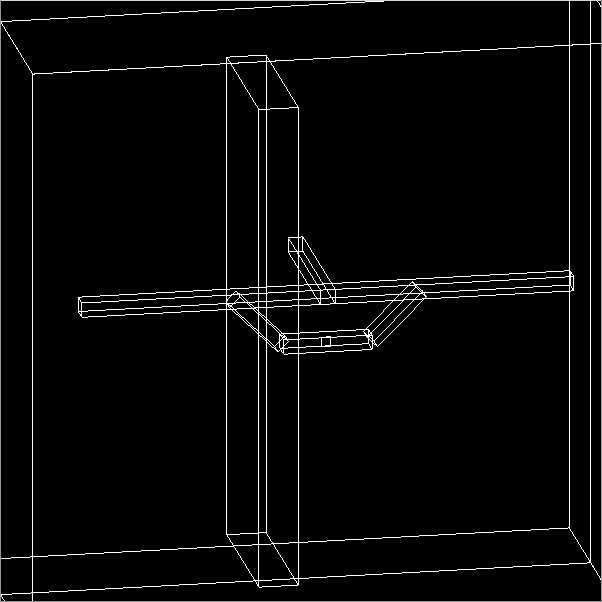
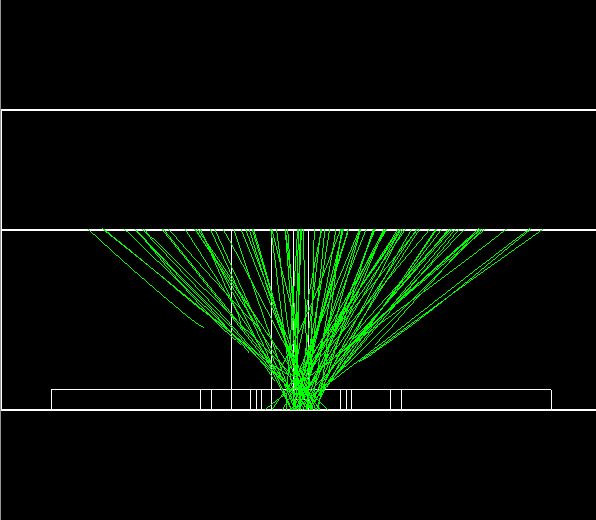
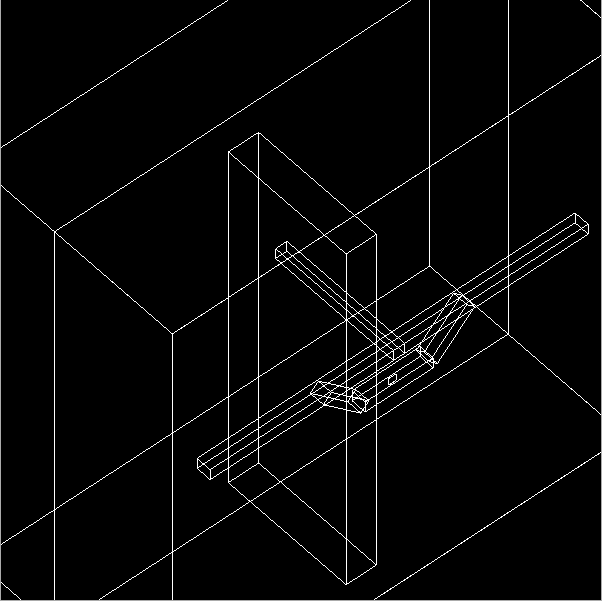
The simulation geometry of the images above is a simplified version of the Waldemar Gallery section where the MiniMu prototype is located. The mine is within a volume of land with a homogeneous density of 2.6 g/cm3 and a height of 18 m. The column of the well contains only air and to its left is the volume of the fault zone, called the fault box, which has a lower density than the rest of the land, 2.2 g/cm3. In this simulation, these two volumes are the targets to be identified in the observation.
The muons flow is simulated, according to a parameterization studied for a given period, and the result is muographs that show the predicted distribution and contrasts between zones of different density in the area under observation.
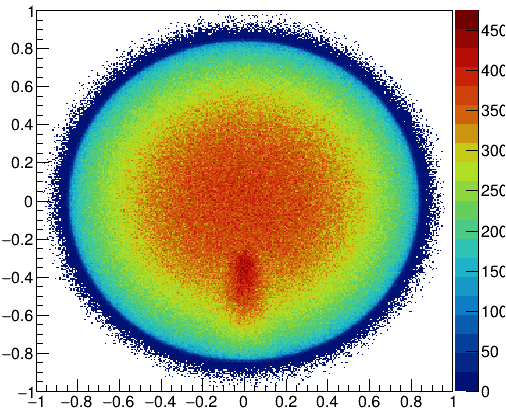
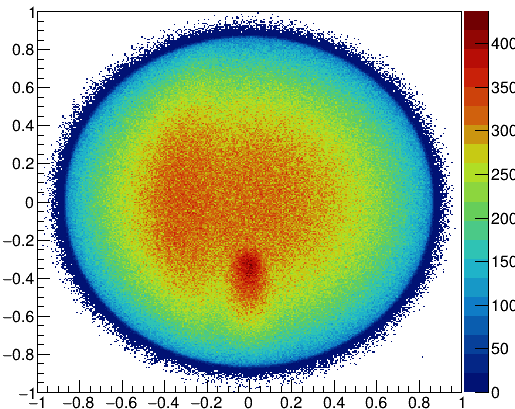
Regarding the left muography, only with the well, it is possible to notice how the distribution of counts changes when the volume of the fault box is introduced, the distribution is no longer symmetrical. As the fault box has a lower density than the terrain, the number of muon counts that reached the detector from that direction increased.
In order to analyze the information contained in the count muographies, two parameters are being used to highlight not only large contrasts but also materials with smaller density differences, such as the fault box.
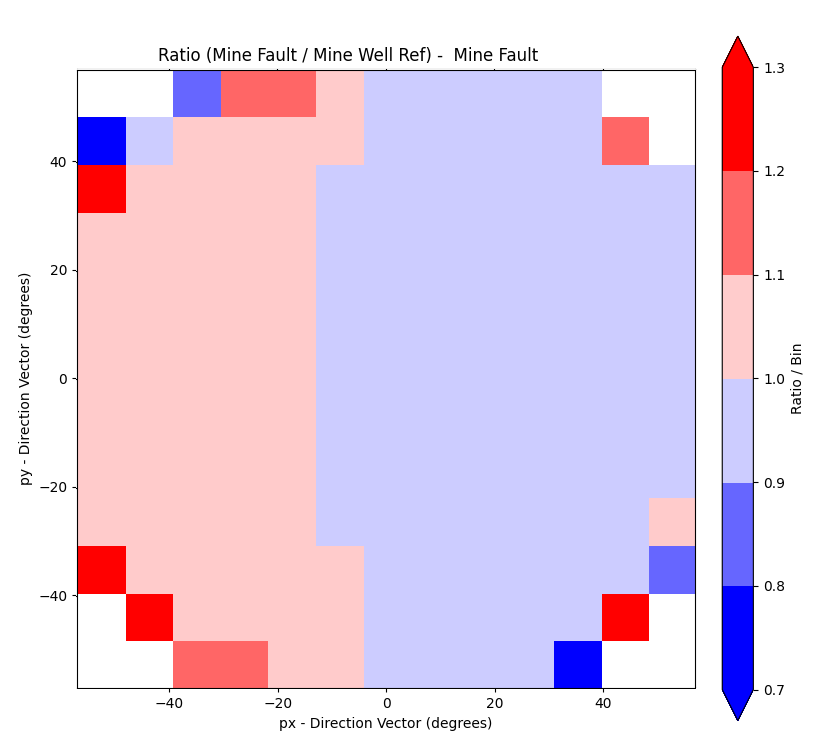
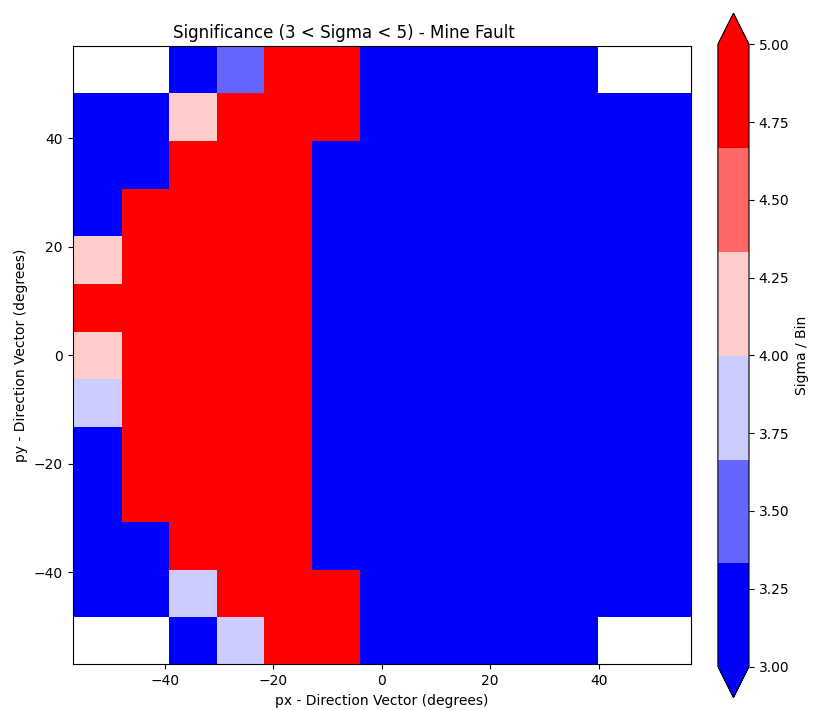
The analysis parameters make use of mathematical operations involving reference muography counts, in this case only the land with the well and without the fault, and the counts resulting from the observation in order to increase the existing contrasts..
Thus, the ratio parameter, which results from dividing the observation counts by the reference counts, and the significance parameter, which shows how significant the difference between the counts is according to the possible fluctuation between them, is being used in other words the associated error.
The result is the above muographies, which use a pixel resolution closer to the detector’s resolution, and which highlight information that was not in the reference, which in this case is the fault zone. The fault box appears in red, meaning that more muons arrived from this zone compared to the reference counts and that this is due to their density being a little lower than that of the surrounding terrain..
